
This post looks further at EPANET as an example of data modelling. The EPANET water supply distribution modelling software is freely available for download with some example networks. A tutorial can also introduce new users to its use and help with understanding. There is no need for you to install this software or follow the tutorial, but if you wish, they are readily available.
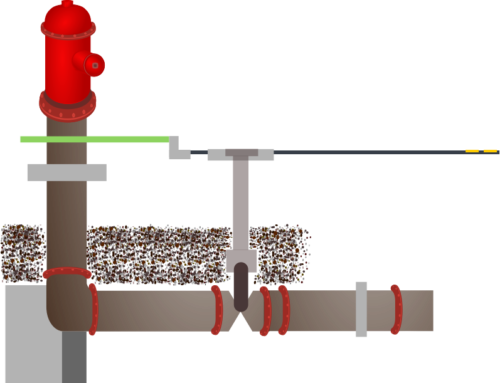
EPANET is designed to model water distribution networks, so the simplest possible “network” would be something like a reservoir with a pipe leading to a single location with a fixed demand for water.
A simple distribution network
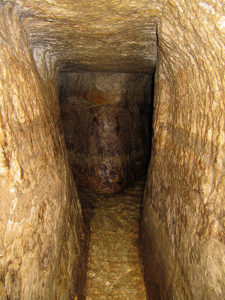
Hezekiah’s tunnel By Tamar Hayardeni תמר הירדני – My own work יצרתי בעצמי, CC BY 3.0, https://commons.wikimedia.org/w/index.php?curid=11136164
Many centuries ago, there was a spring outside the walls of Jerusalem which provided water for the city. Around 720BC, King Hezekiah heard that the king of Assyria was coming to attack Jerusalem, so he wanted to make sure that the water from the spring was available for the city, but would not provide water for the attacking army. He dug a tunnel about 530m (1750ft) long (see picture at right) and redirected the water to a pool inside the city. The spring was sealed off from the outside and as a result, the city was made easier to defend. If you go to Jerusalem today, you can still see the tunnel and read the inscription which was placed just inside the tunnel entrance and described the final stages of its construction. Hezekiah’s water supply solution was the simplest water distribution network we could model: a spring, a tunnel and a pool, modelled as a reservoir, a pipe and a demand for water.
Without knowing anything about water distribution modelling, this example raises questions which highlight some standard solutions used in modelling and also the many options available to us when we are modelling.
Unique Identifiers (IDs)
Let’s start with a “standard solution” which we find in this input file format. To identify each of the objects in a table, database or data set, it is common to use unique identifiers, and the EPANET input file is no exception. However, there is also a fundamental matter of principle with identifiers (IDs): should the IDs have any meaning, and should the user have any interest in or access to the IDs? The EPANET interactive program takes the position that IDs should be assigned by the user and can have some meaning to the user. Prefixes can be defined for different classes of equipment (eg. a user might configure pipes to have a prefix of “PIP” to help with identification) and most characters on a keyboard can be used in the IDs. However, it also provides tools to make the assignment easier. Optional auto-incrementing of digits at the end of IDs is provided, as well as checks for duplication.
Many data modellers will say that IDs should never have any meaning and should never be accessible to the ordinary user of software. If this approach is taken, then IDs will normally be created using auto-incremented columns or by fetching values from database sequences. This has the advantage that the ID cannot be edited, so it will never change, however, users may still require a unique identifier of their own which they can edit and which must be provided with optional uniqueness checks and possibly special search facilities.
How unique is unique?
IDs must be unique within a class of objects or a group of classes. As a modelling decision, this also affects the usability of a data set if the user has access to or control over the IDs. Within the EPANET model, some classes of objects are grouped together: for example reservoirs, tanks and junctions are all called “nodes” (having a single connection point) and the IDs of any of these objects must be unique across all of the objects. Thus a reservoir cannot have the same ID as any tank or junction.
Where users have input to unique identifiers (either the unique identifier used for a database row or another unique identifier assigned by the user), the extent of that uniqueness must be clearly defined.
Maps, locations and schematics
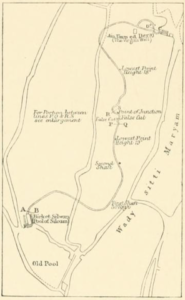
By Charles Warren and Claude Conder – The survey of Western Palestine-Jerusalem (1884), Public Domain, https://commons.wikimedia.org/w/index.php?curid=36470777
A water supply distribution network has physical locations and these can be important when presenting data to users. Users may wish to have the network data displayed over the top of an OpenStreetMap map, as this can be very useful with the assignment of tasks to maintenance staff and in many other ways. However, a network analysis tool only needs connectivity and length information – physical location is irrelevant.
Not only so, but water supply networks are notoriously difficult to display if the equipment location has been entered accurately and items are to be displayed according to their physical size. Pipes can be very long and tanks can be very large, while valves and pumps can be very small, yet the clear display of valves and pumps is often vital to understanding how a network will operate. A schematic presentation can be more suitable, but can also be awkward because automatically generated schematics can sometimes change significantly if even a single additional pipe is added to the network. More than one form of presentation may be required and separate information may be required for each presentation method.
At times, these contrasting requirements can make partitioning of the data worthwhile. For example, it may be worth storing the connectivity and length data in one table for analysis, while storing presentation information in another.
Fundamental constraints
A water distribution network needs one thing more than anything else: water. The EPANET input file has several data constraints, but one of them is very simple: a network must have at least one reservoir or tank. The water we are distributing has to come from somewhere!
If we are to model an input file, can we model this sort of data constraint?
Acknowledgements
[1] Tunnel in 2010 by Tamar Hayardeni תמר הירדני – My own work יצרתי בעצמי, CC BY 3.0, https://commons.wikimedia.org/w/index.php?curid=11136164
[2] 1884 sketch of the tunnel, by Charles Warren and Claude Conder – The survey of Western Palestine-Jerusalem (1884), Public Domain, https://commons.wikimedia.org/w/index.php?curid=36470777

Leave A Comment